What are audiograms?
Visualizing your hearing loss
It may look like something out of your high school math book, but an audiogram is a great way to get a comprehensive look at your hearing abilities. Typically shown with one line for each ear, an audiogram plots a person’s hearing threshold based on frequency and decibel level. Some audiograms also measure speech reception threshold, or the softest level of sound in which someone can understand speech. In this case, the space between the hearing and speech reception threshold is referred to as the speech discrimination score.
This clear overview of hearing test results can help your Hearing Care Professional better diagnose your level of hearing loss and determine the best course of action.

Degrees of hearing loss
Measuring your hearing abilities
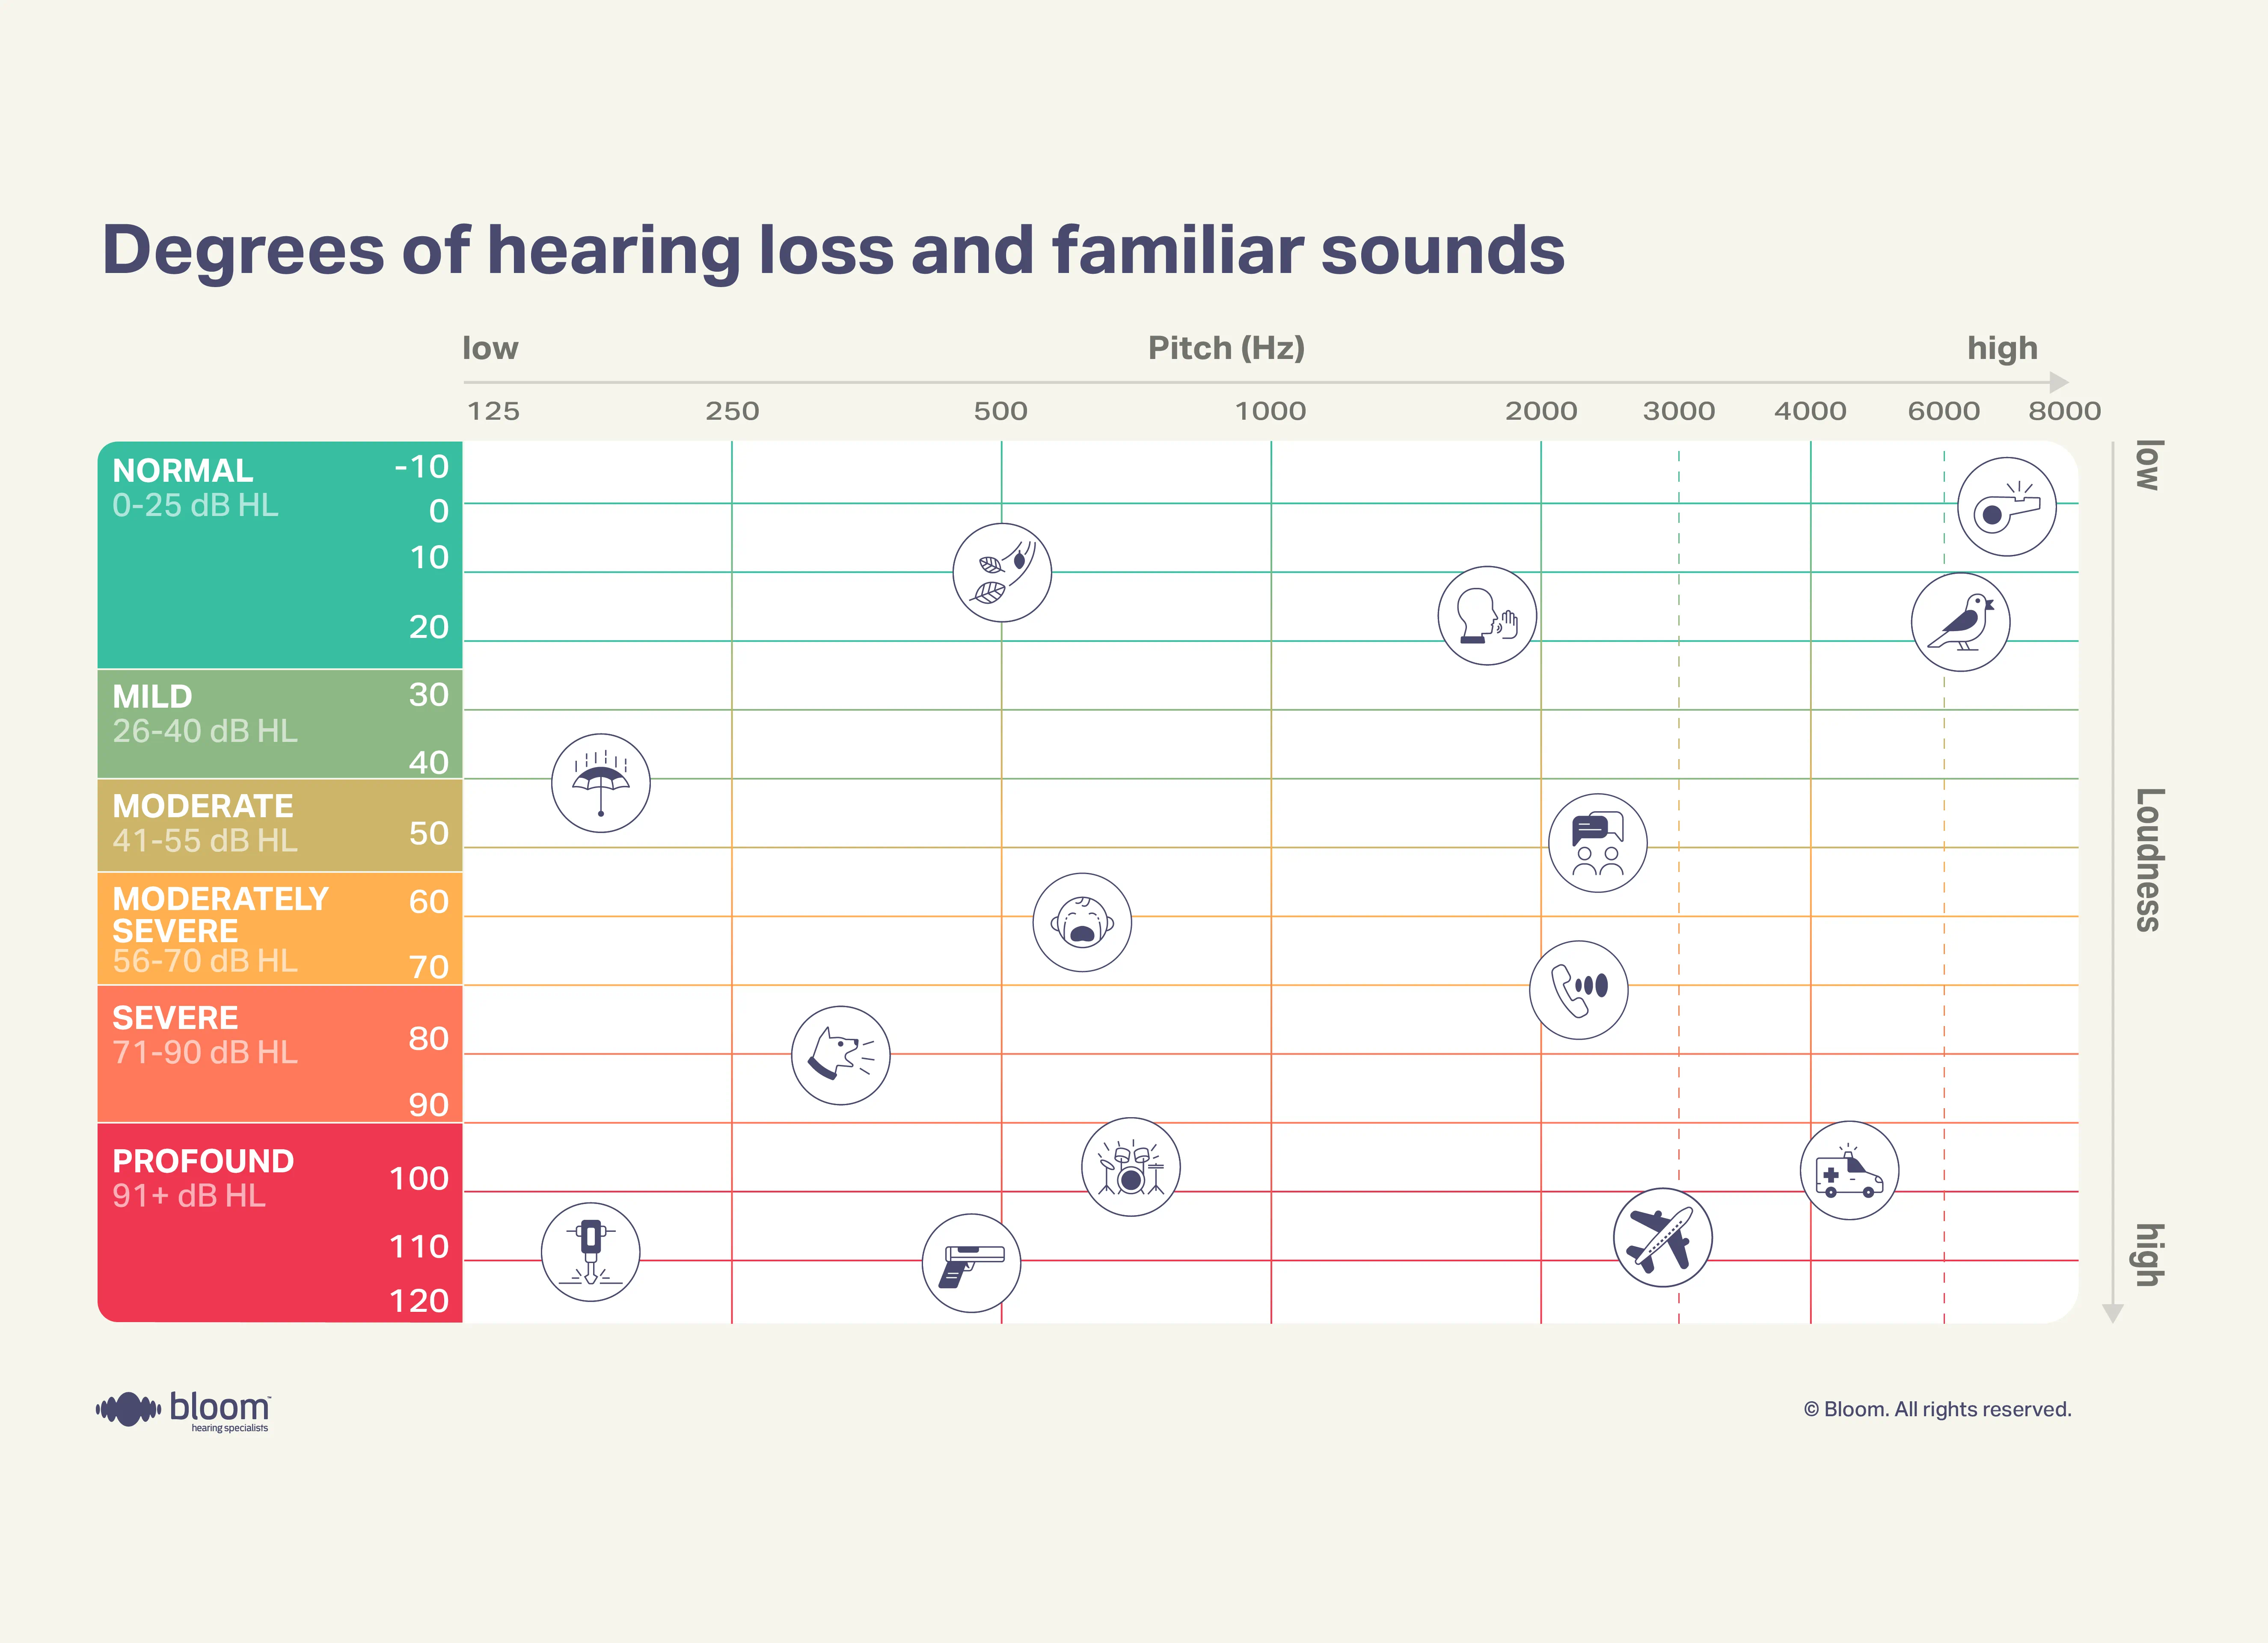
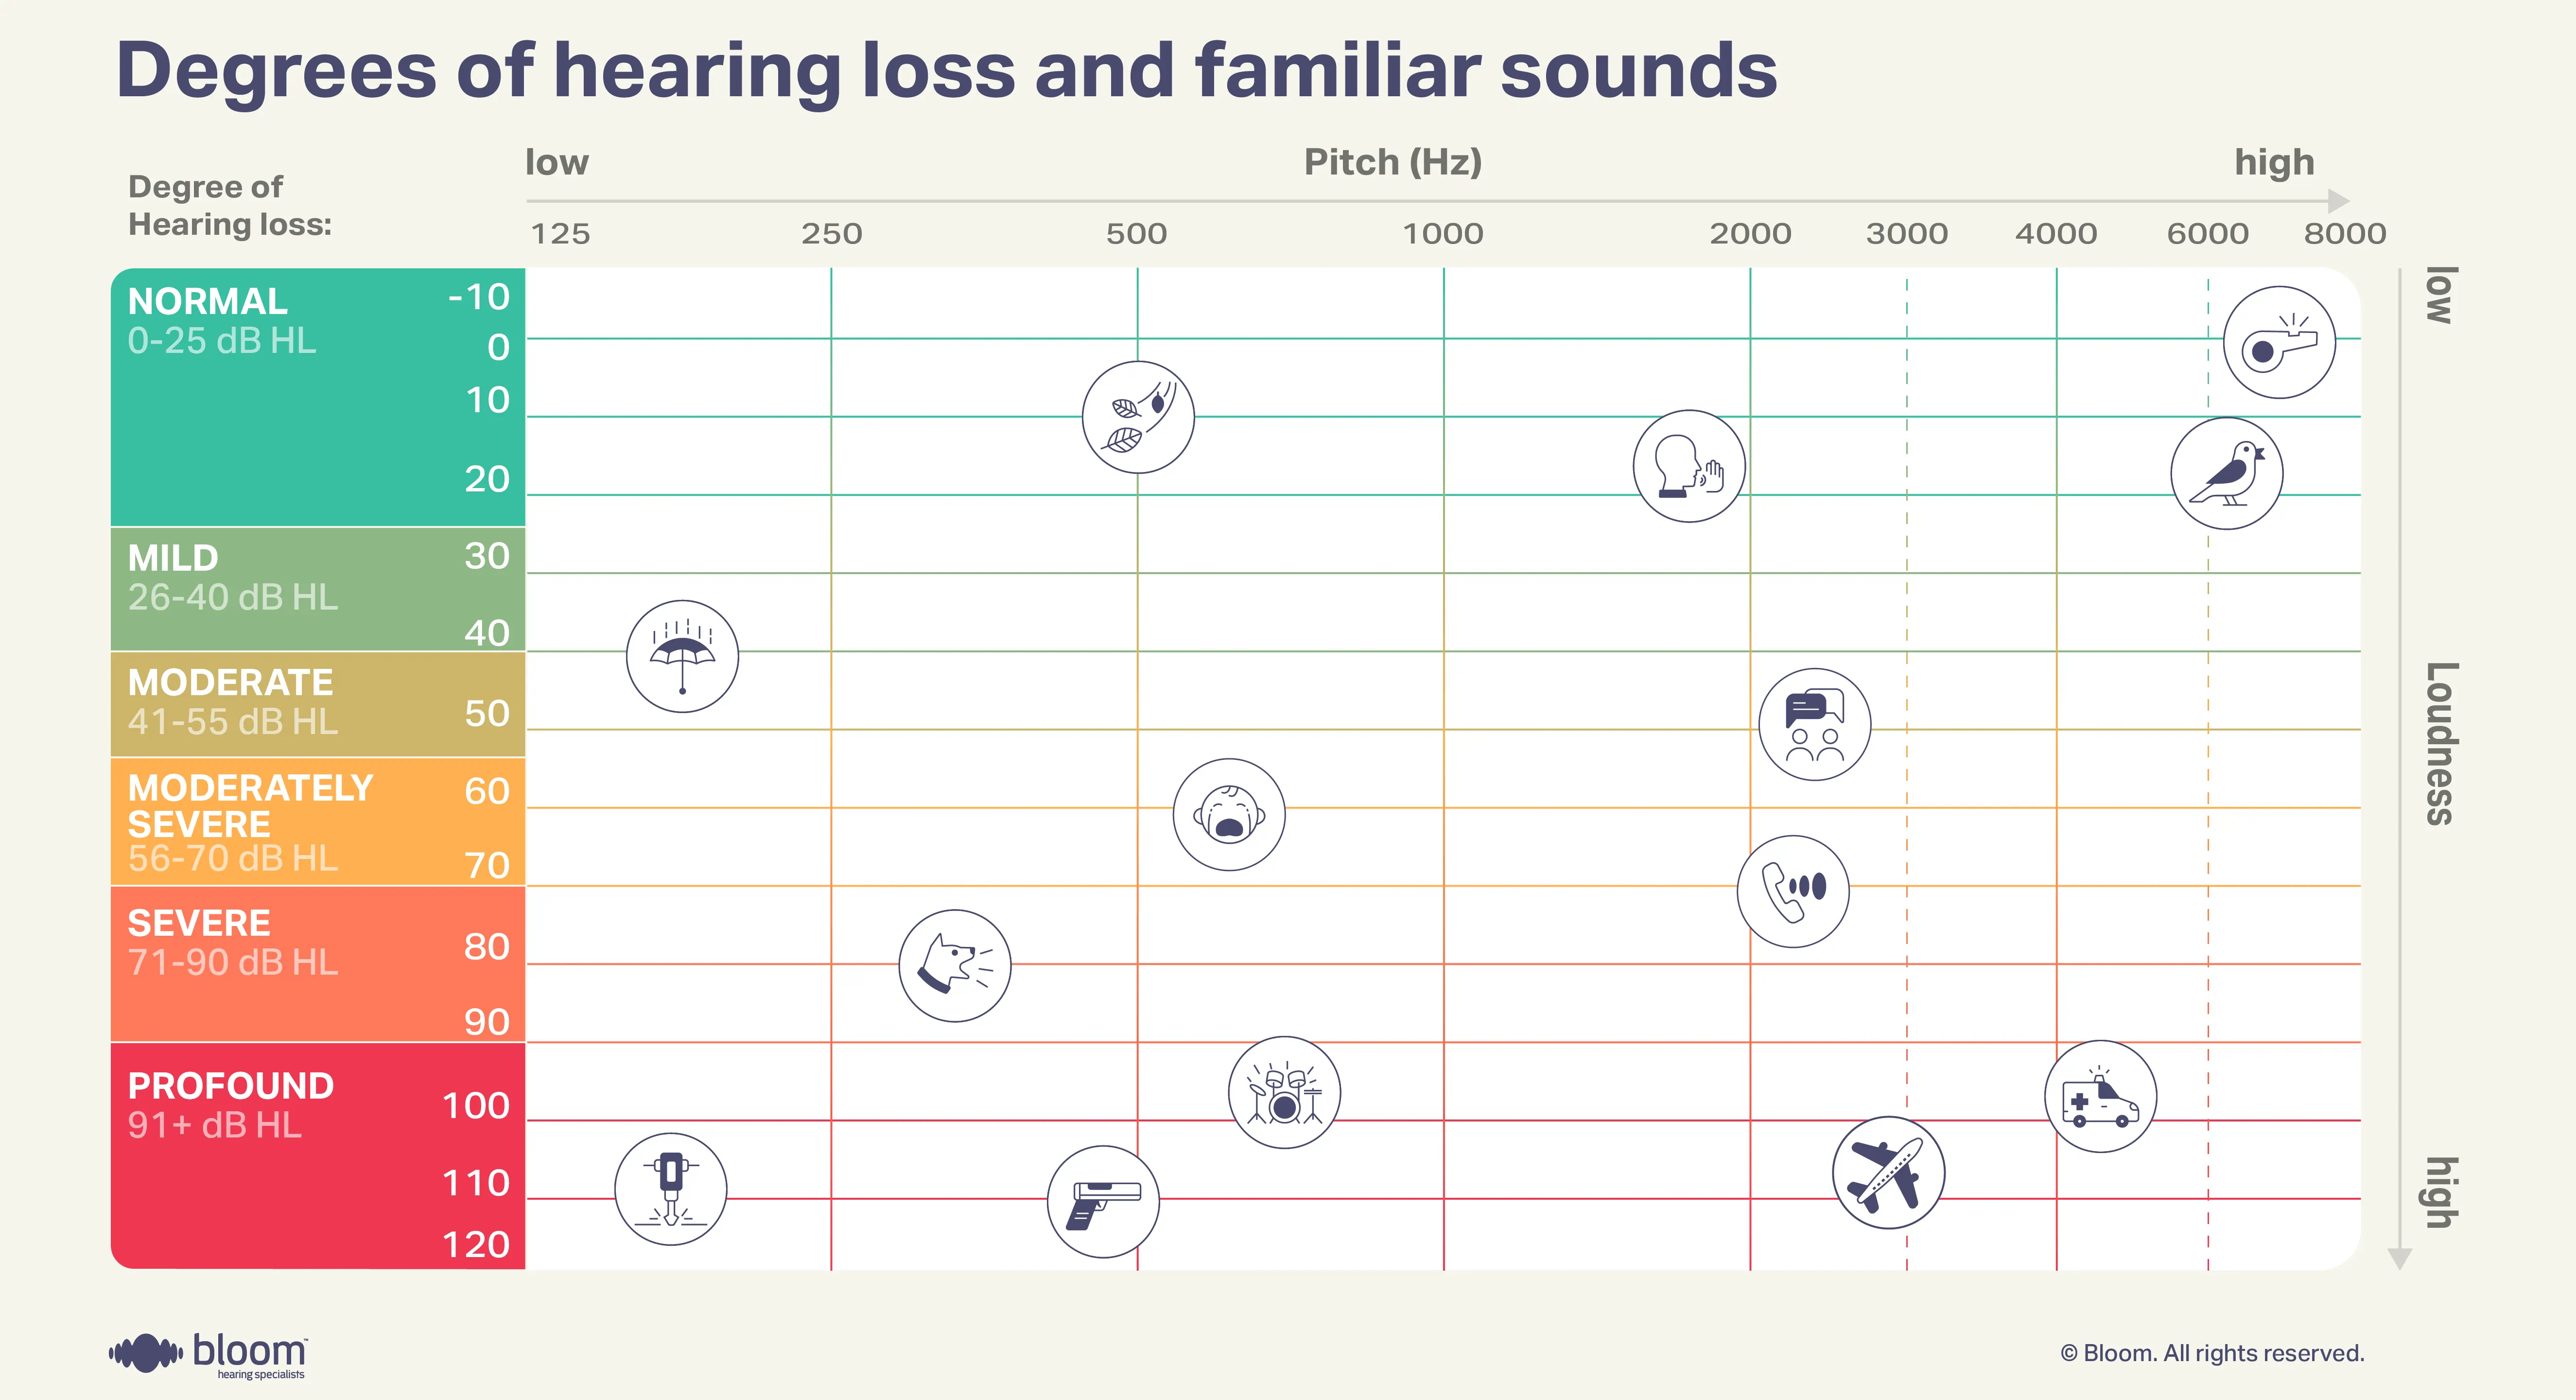
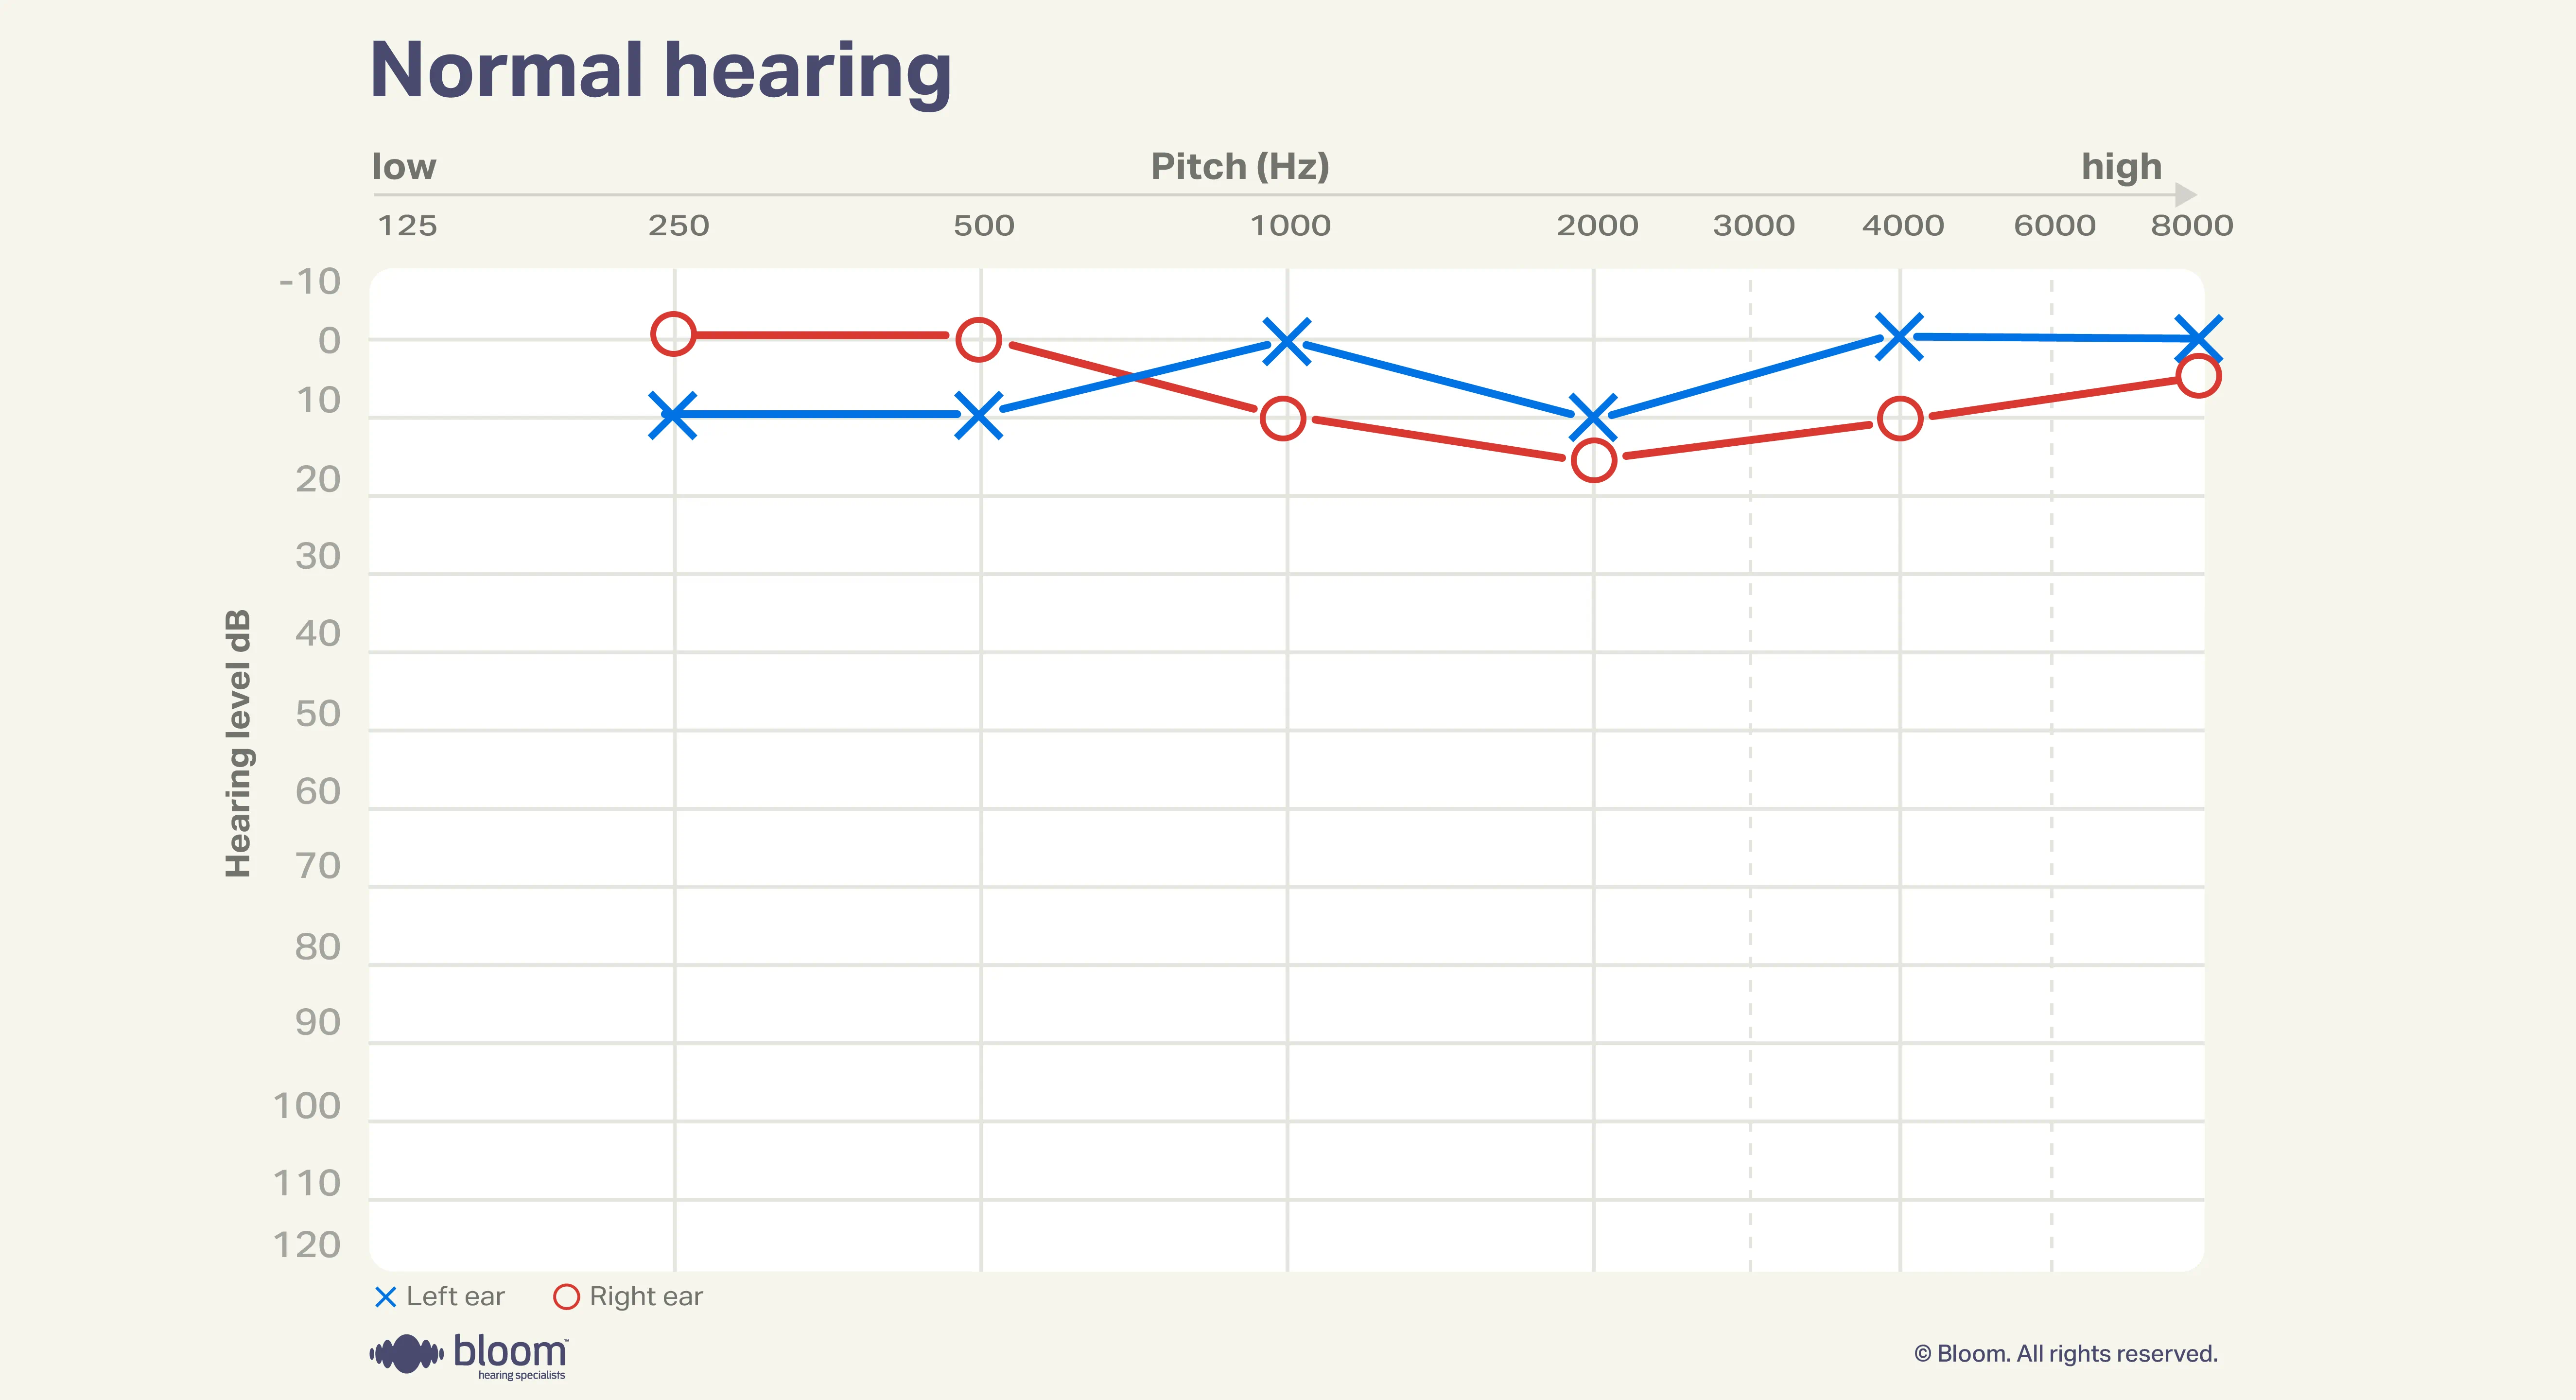
An audiogram can be split into five categories. A hearing threshold plotted between 0 and 20 dB represents a normal range of hearing. The four categories below this threshold indicate some level of hearing loss. The lower the line, the higher the degree of impact on the person’s daily life may be.
Mild hearing loss (21-45 dB)
You may find it challenging to hear the following:
- Soft speech sounds and words, especially in noisy environments
- High-pitched sounds, such as birds chirping, the beeping of a microwave, or the sound of a child's voice
- Faint sounds that are distant or quiet, such as a clock ticking or a car passing in the distance.
- High-frequency, consonant sounds, such as "s", "f", "th", and "sh"
- Individual instruments or notes in music, making it harder to enjoy music fully.
Moderate hearing loss (46-65 dB)
You will most likely begin to find it difficult hearing sounds, especially the higher-pitched frequency. You may have to ask people to repeat themselves more often and gradually find it challenging to hear even normal conversations, making it harder to participate in group discussions. You may find it challenging to hear the following:
- The sound of a television or radio at normal volume
- Consonants such as "s," "f," and "th" in speech, which are important for understanding the meaning of words
- Soft-spoken individuals or children's voices
- Conversations in noisy environments, such as restaurants or parties
- High-frequency sounds, such as the chirping of birds or the rustling of leaves
- Certain musical instruments, such as violins and flutes, which produce high-frequency sounds
- Alarm clocks and other high-pitched alerts, which may not be audible without assistance from hearing aids or other devices.
Severe hearing loss (66-90 dB)
You may struggle to hear certain sounds, particularly high-frequency sounds. These include:
- Birds chirping
- Doorbells and telephones ringing
- High-pitched voices, particularly those of women and children
- Whistles or beeps
- High-frequency consonant sounds, such as "s," "sh," "f," and "th"
- Certain musical instruments, such as flutes and piccolos
- The sound of rustling leaves or grass
- Water dripping or running
- Some consonant sounds, such as "s" and "f" in speech
Profound hearing loss (91 dB)
Even though you can still hear some loud noises, you may have difficulty hearing a wide range of sounds, including many low and high-frequency sounds. Communicating with others is no longer possible, even when you make an increased effort to hear. You can no longer hear sounds under 91 dB. Examples of sounds that may be hard to hear include:
- Low-pitched voices, particularly those of men
- Deep bass notes in music
- Thunder and other loud, low-frequency noises
- The sound of a car engine or other machinery
- Footsteps and other soft, low-volume sounds
- High-pitched alarms and sirens
- Consonant sounds such as "s" and "f" in speech, which carry important information about meaning and context.
- The subtle nuances of speech, such as tone, inflection, and emotion, which can be difficult to discern without hearing all the frequencies of speech sounds.
Understanding audiograms
How to read an audiogram
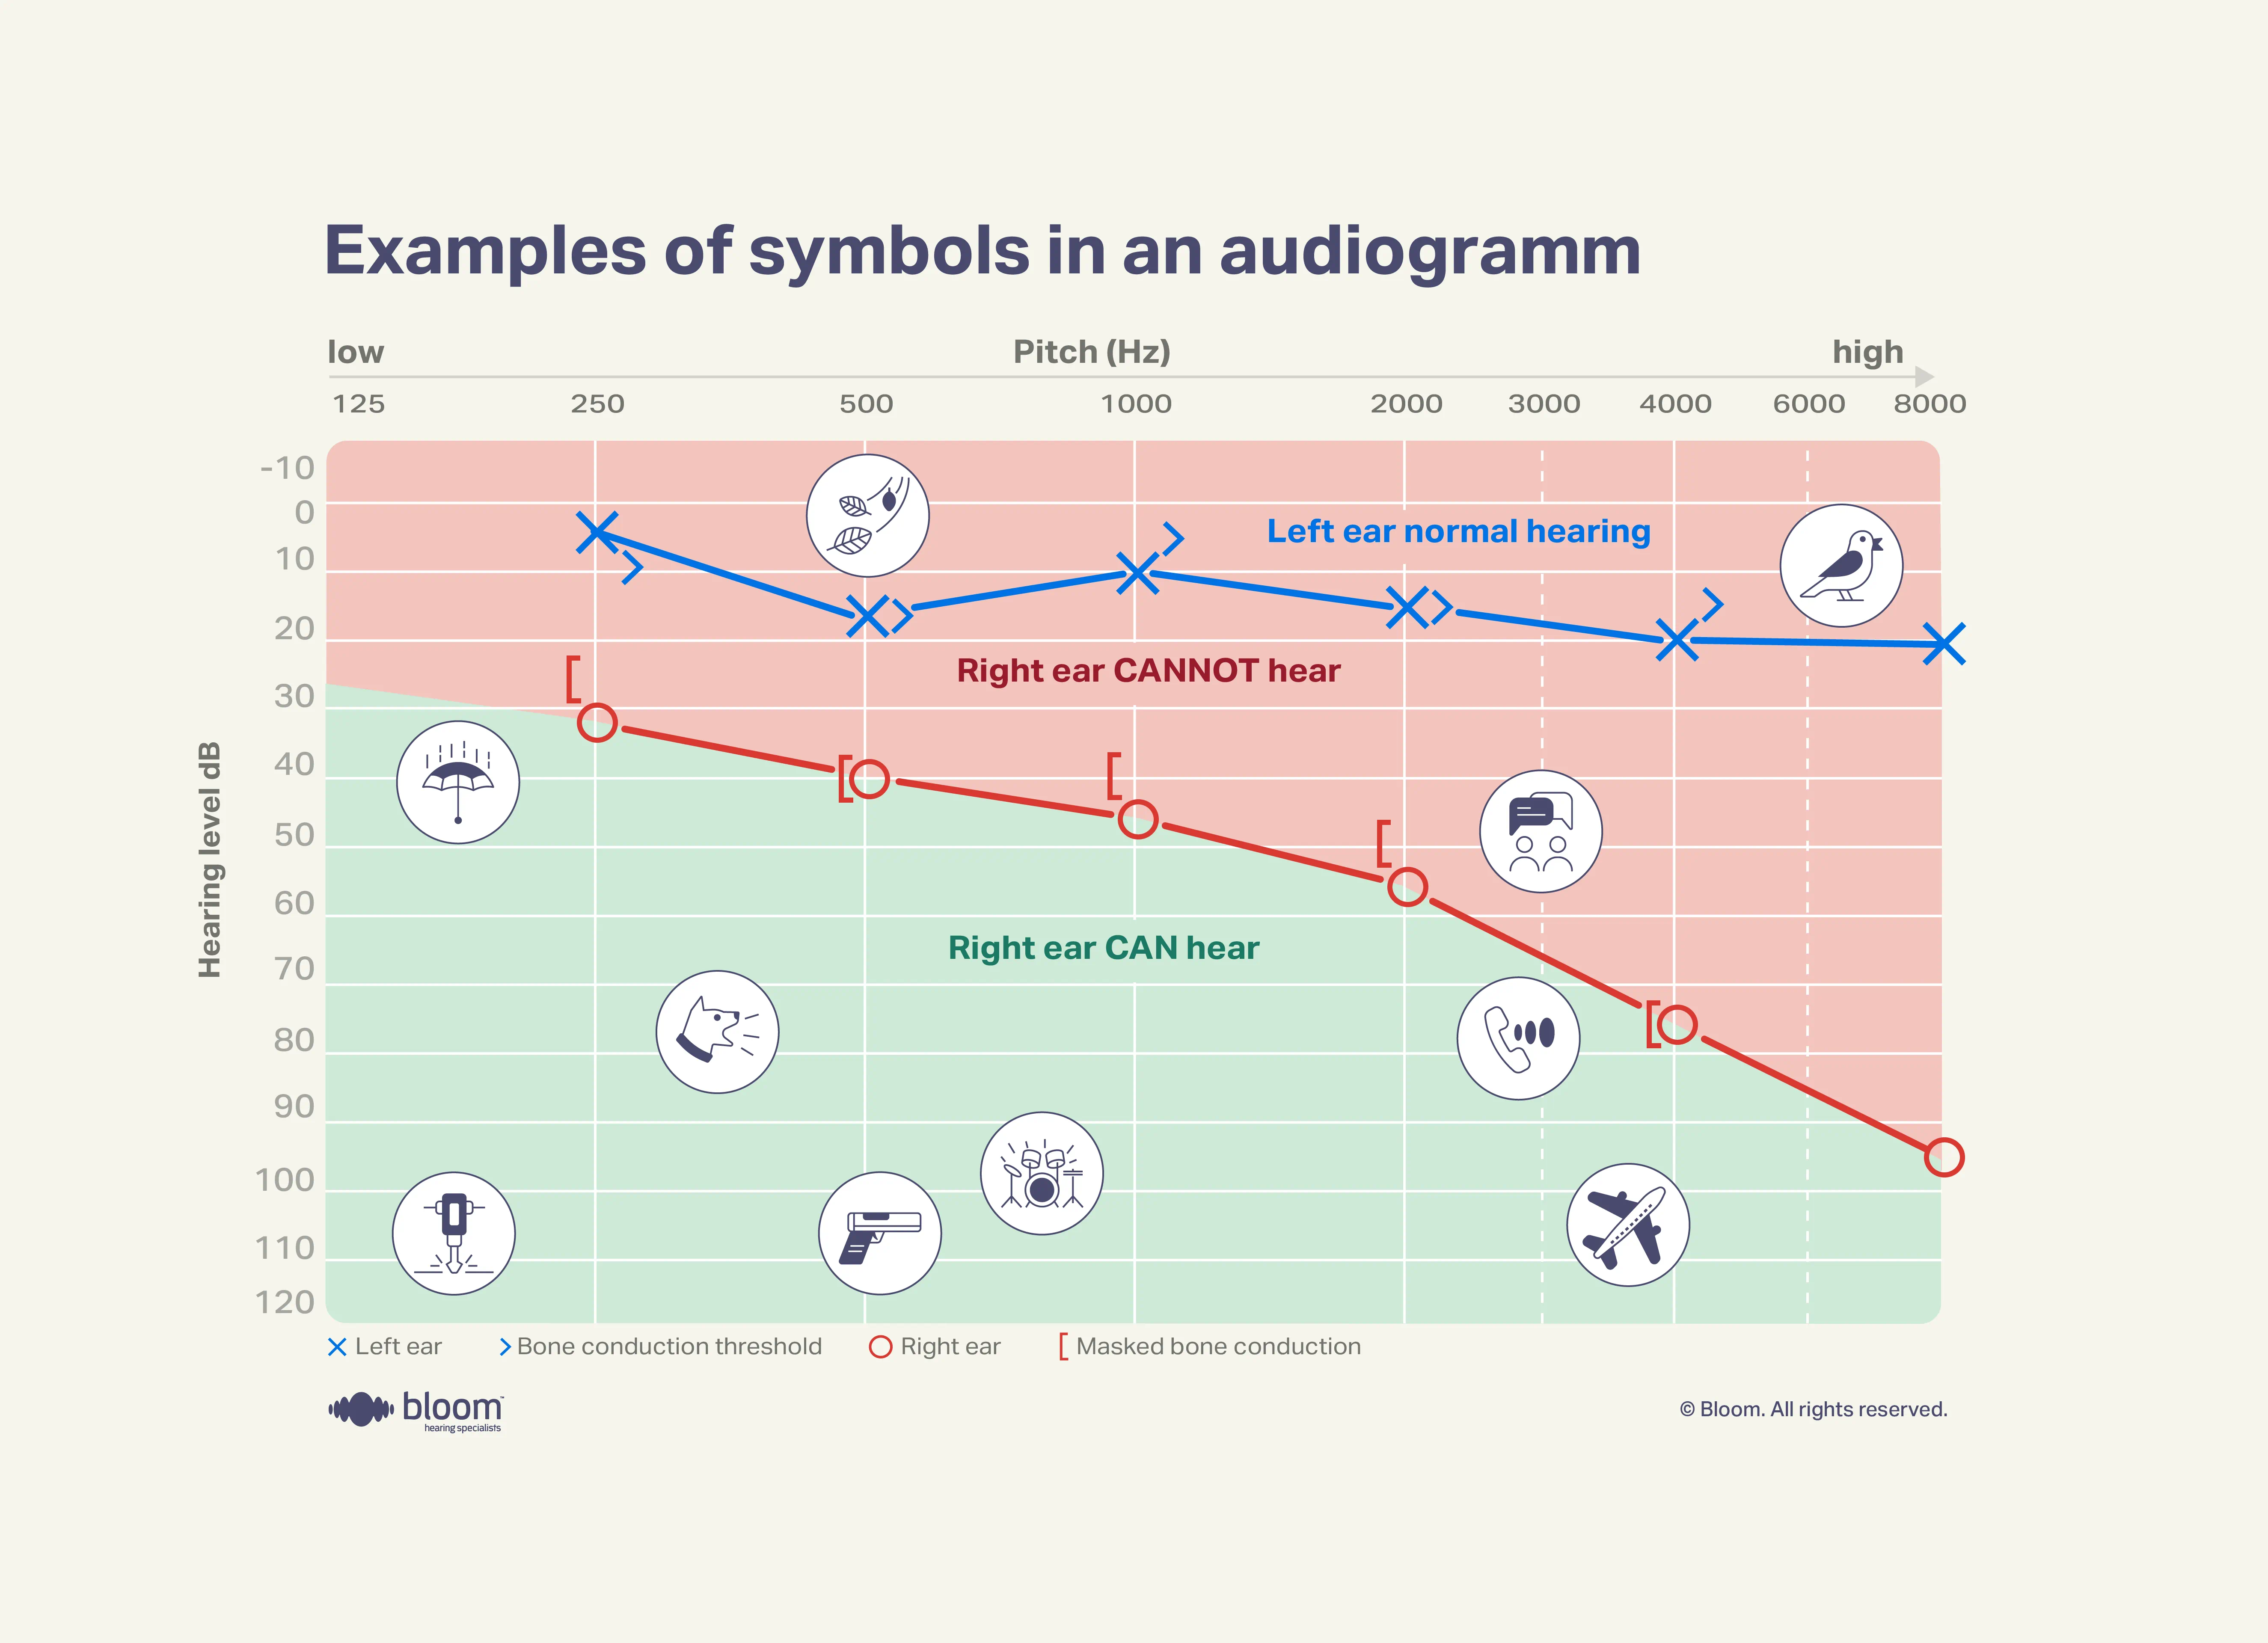
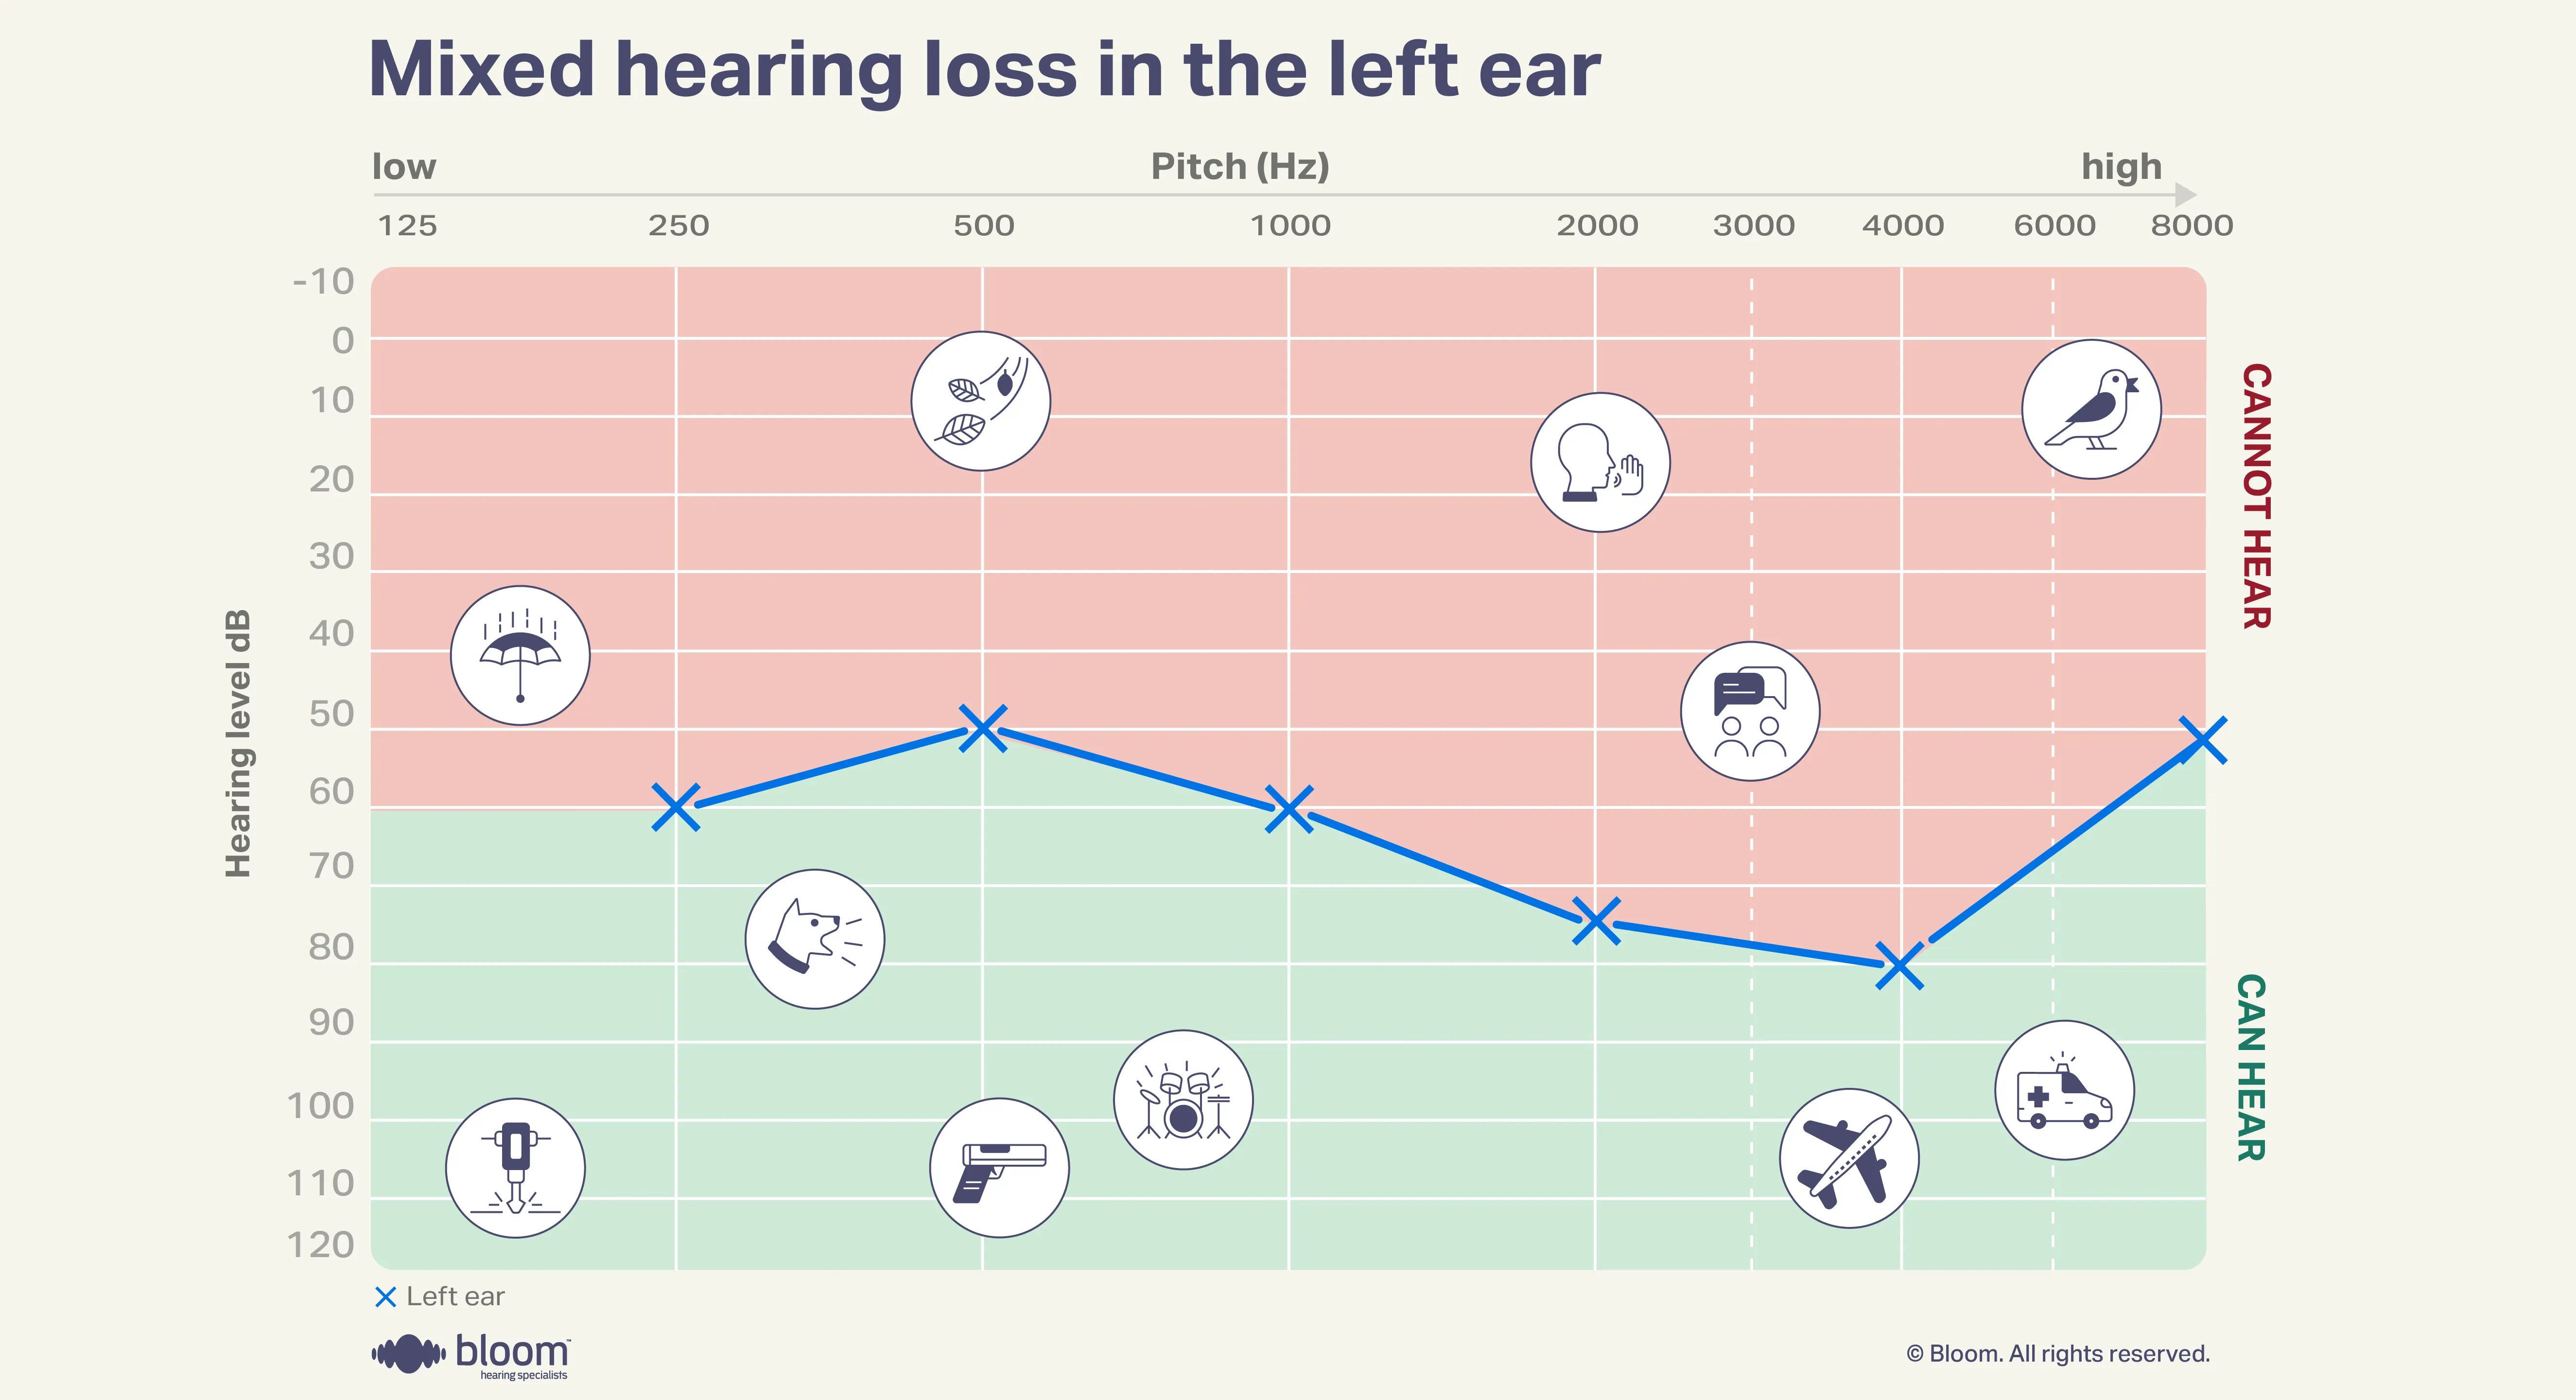
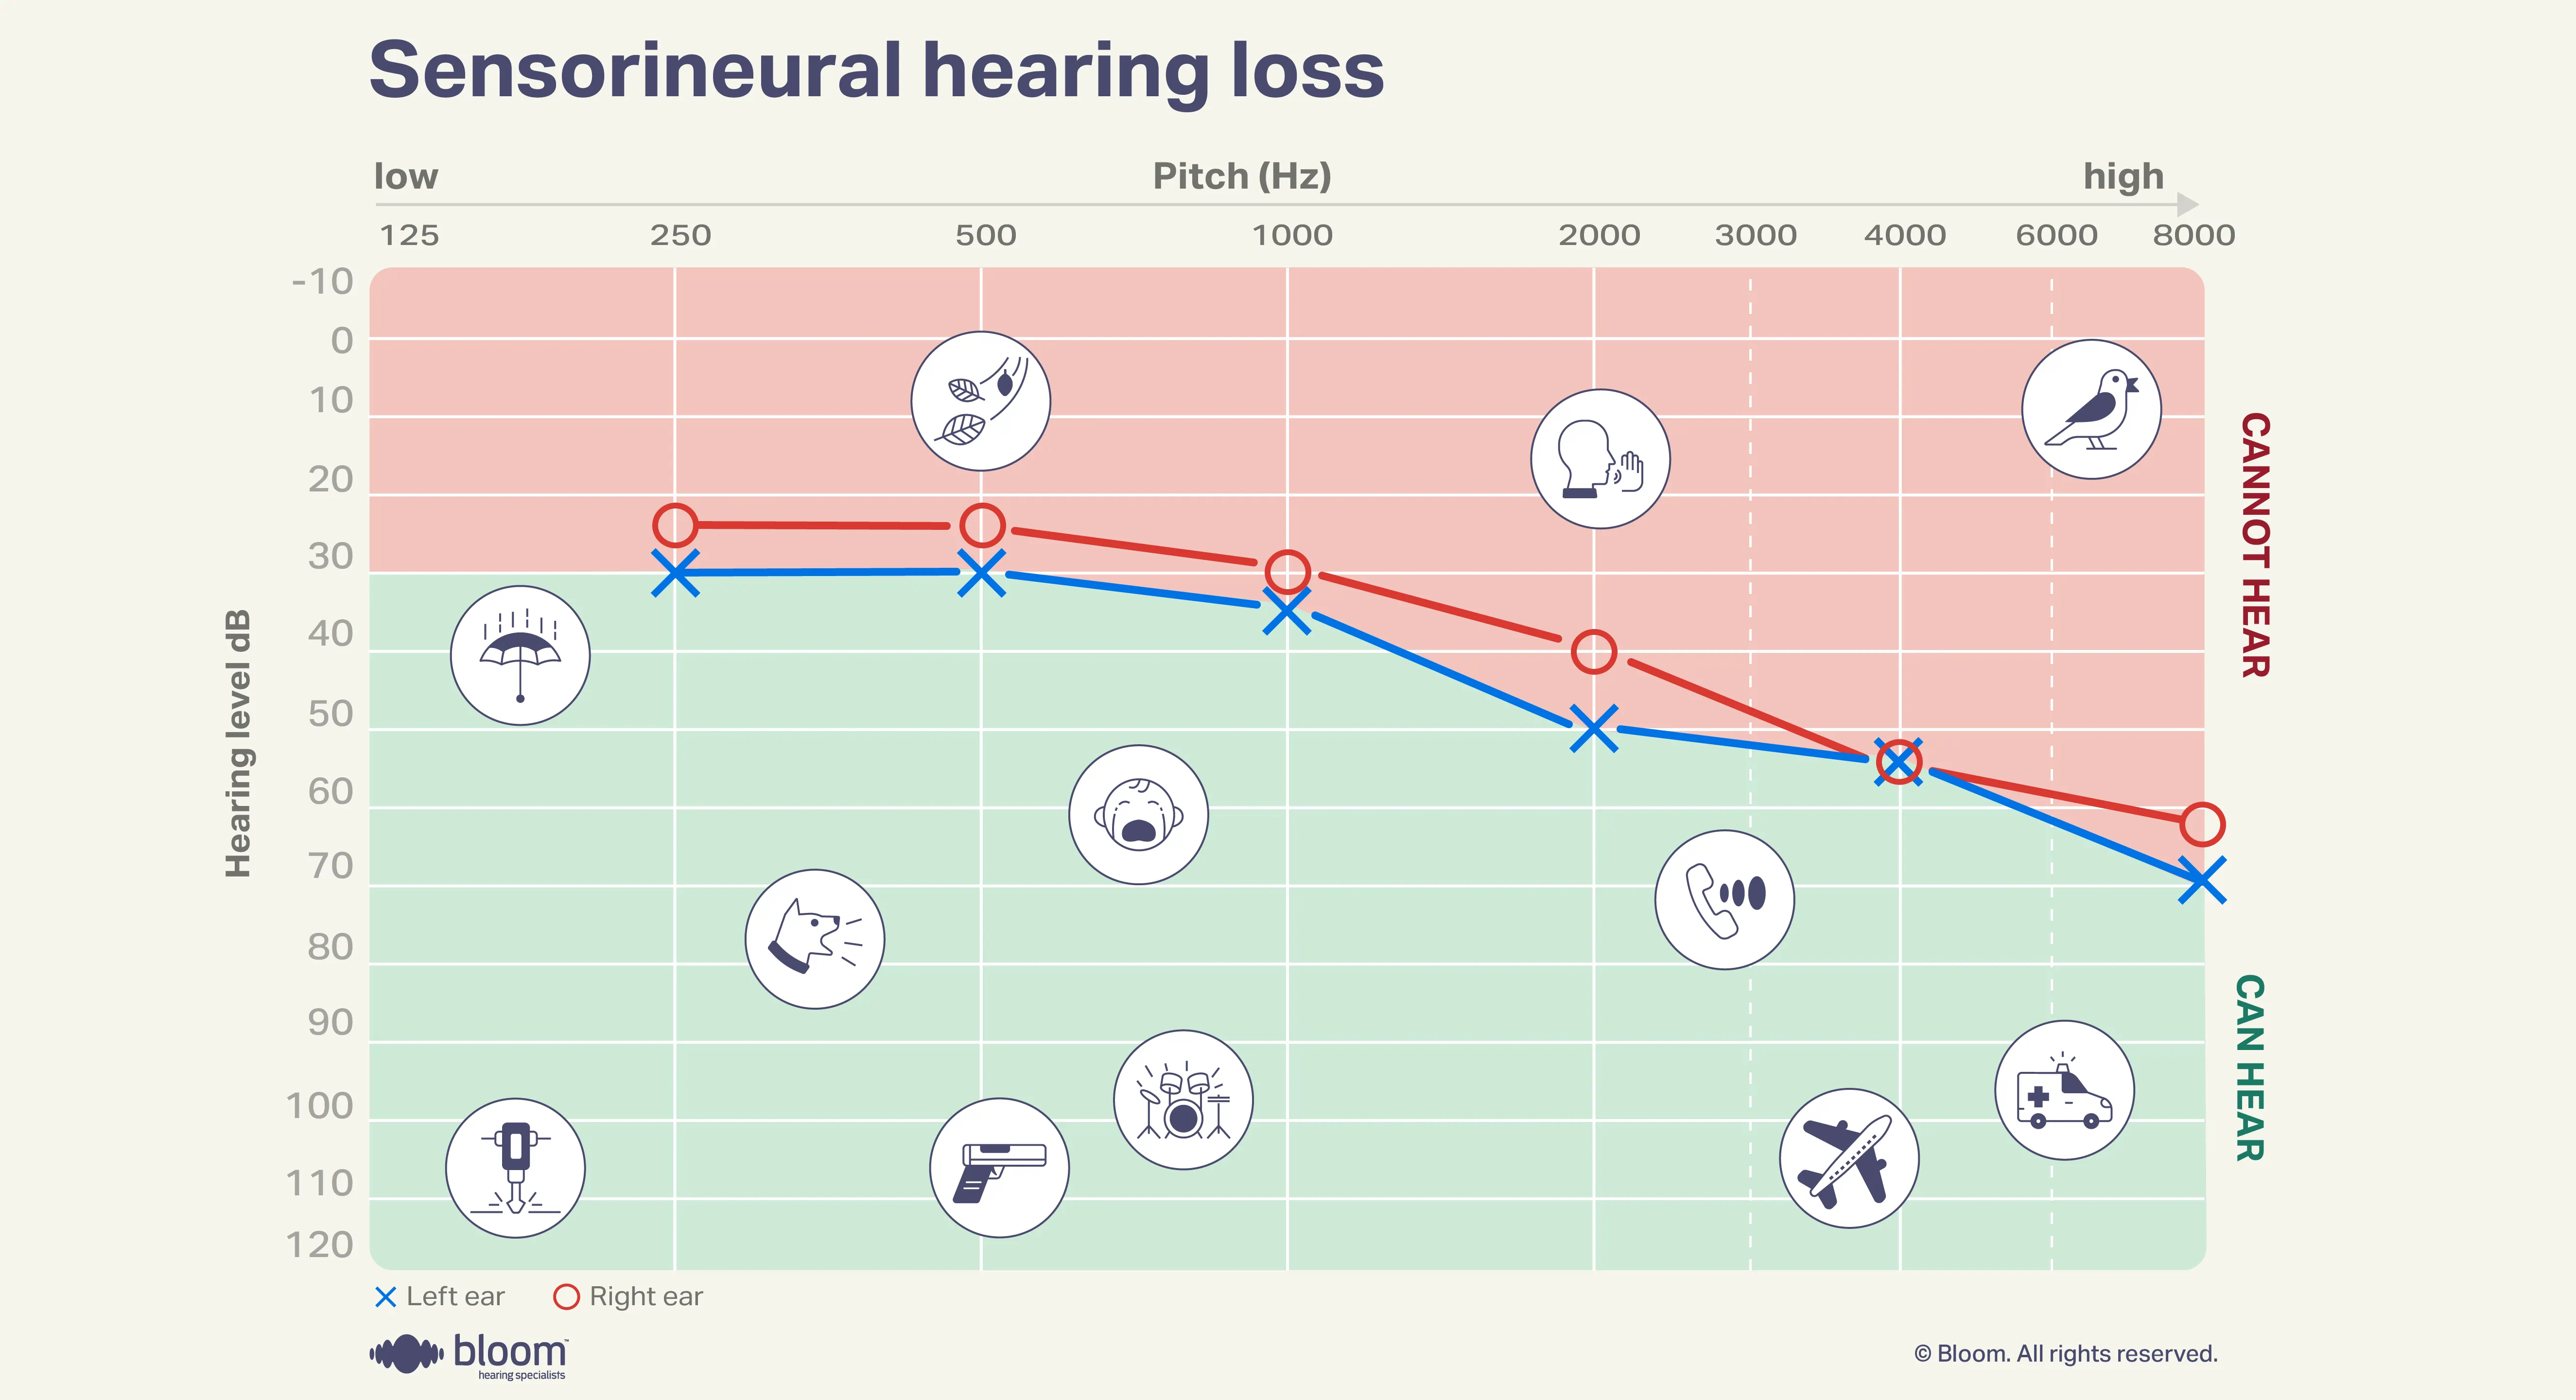
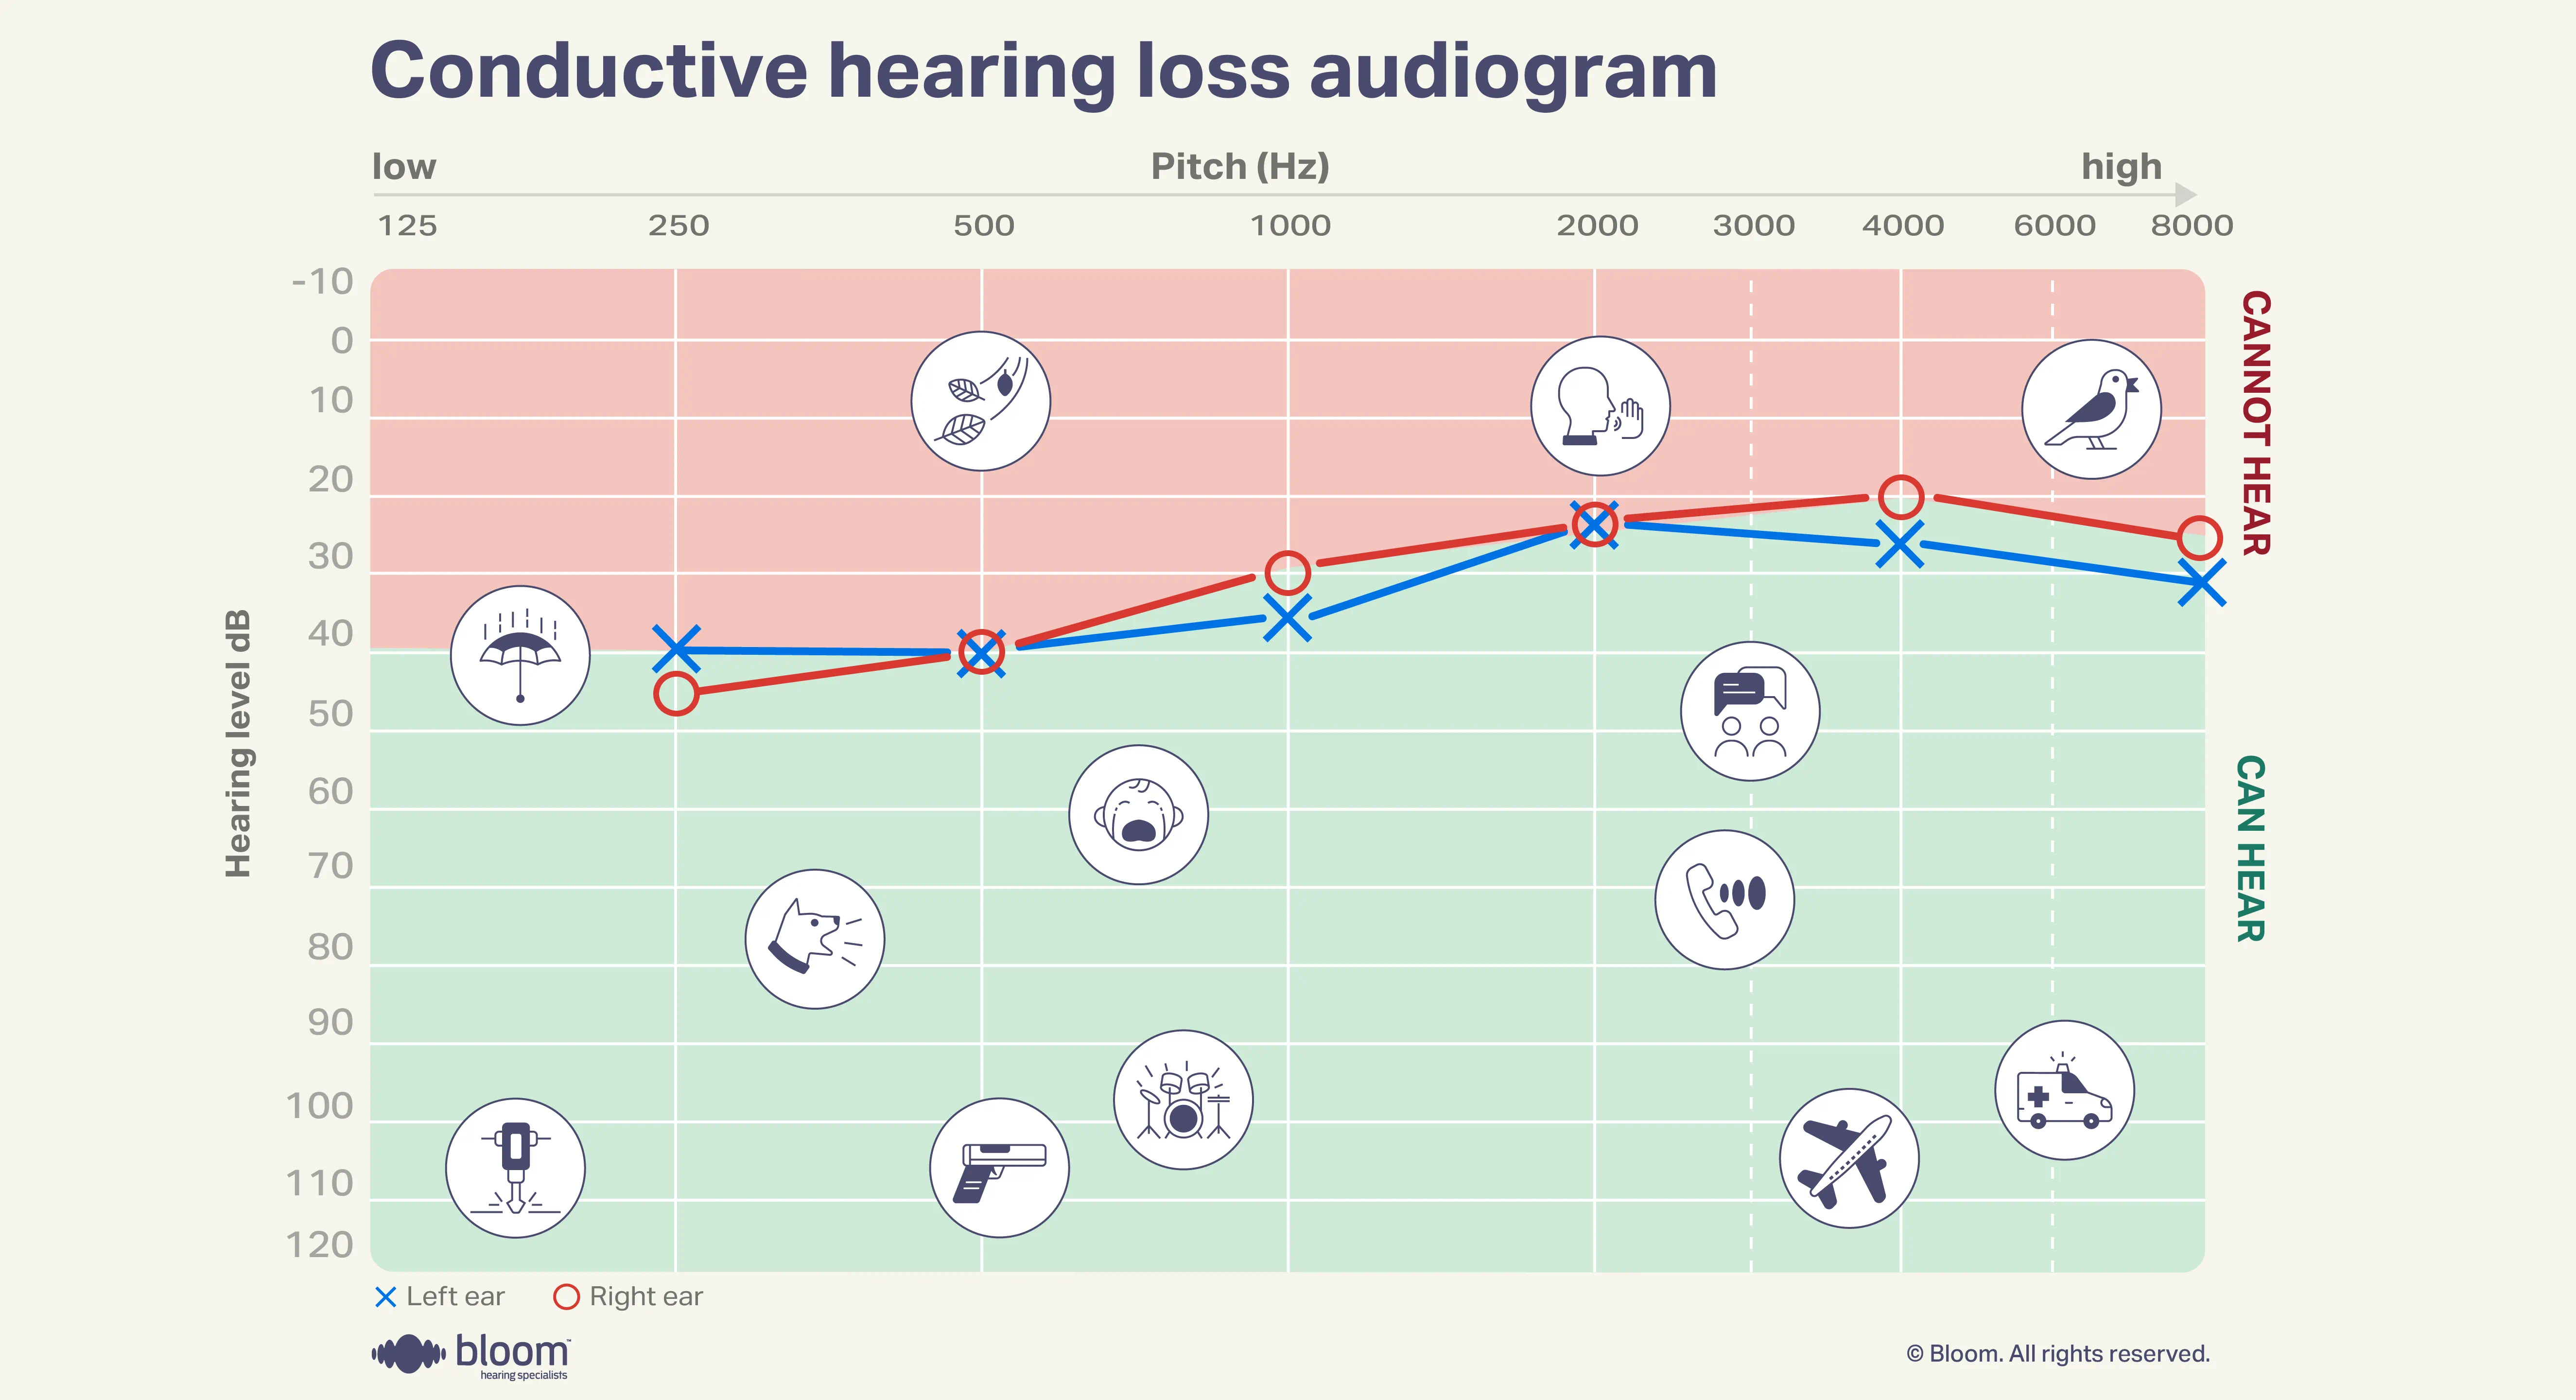
An audiogram is a graph of the softest sounds your ears can hear at different frequencies or pitches.
The horizontal axis represents frequency, showing low to high tones from left to right. Low pitch sounds, these characteristics are not inherent to pitch and loudness and can vary greatly depending on the source of the sound.
The vertical axis shows loudness in decibels from top to bottom.
Your left ear is indicated by an X and your right ear by a circle. The lower the symbols are on the graph, the louder the sound needs to be for you to hear it.
In addition to your hearing test results, your Hearing Care Professional will also consider your medical and hearing health history, your individual hearing challenges and a physical examination of the ear.
Common audiogram symbols
Audiogram symbols are used to represent the different frequencies and levels of hearing loss on an audiogram. They can be combined to create a visual representation of one’s hearing abilities, with the placement of the symbols indicating the frequency and degree of hearing loss. Some common audiogram symbols include:
- X
Indicates the hearing threshold for the left ear and is sometimes marked as blue.
- O
Indicates the hearing threshold for the right ear and is sometimes marked as red.
- < >
Indicates bone conduction thresholds and is often marked with < for the right ear and > for the left ear. This will tell determine how well you hear and if there is a problem in the outer or middle ear.
- [ ]
Indicates masked bone conduction. [ is the symbol for the right ear and ] is for the left ear. While testing your hearing we introduce noise to the non-tested ear to make sure the ear being tested hears the tone and is not “cross-heard” by the non-tested ear.
Types of audiograms
Here's what audiograms look like
Audiogram examples

Audiograms: FAQ
What is an audiogram?
How is hearing loss classified on an audiogram?
How is an audiogram read?
What is the speech reception threshold on an audiogram?
What can cause a hearing loss that is visible on an audiogram?
How long does an audiogram test take?
Types of hearing loss
Explore more options